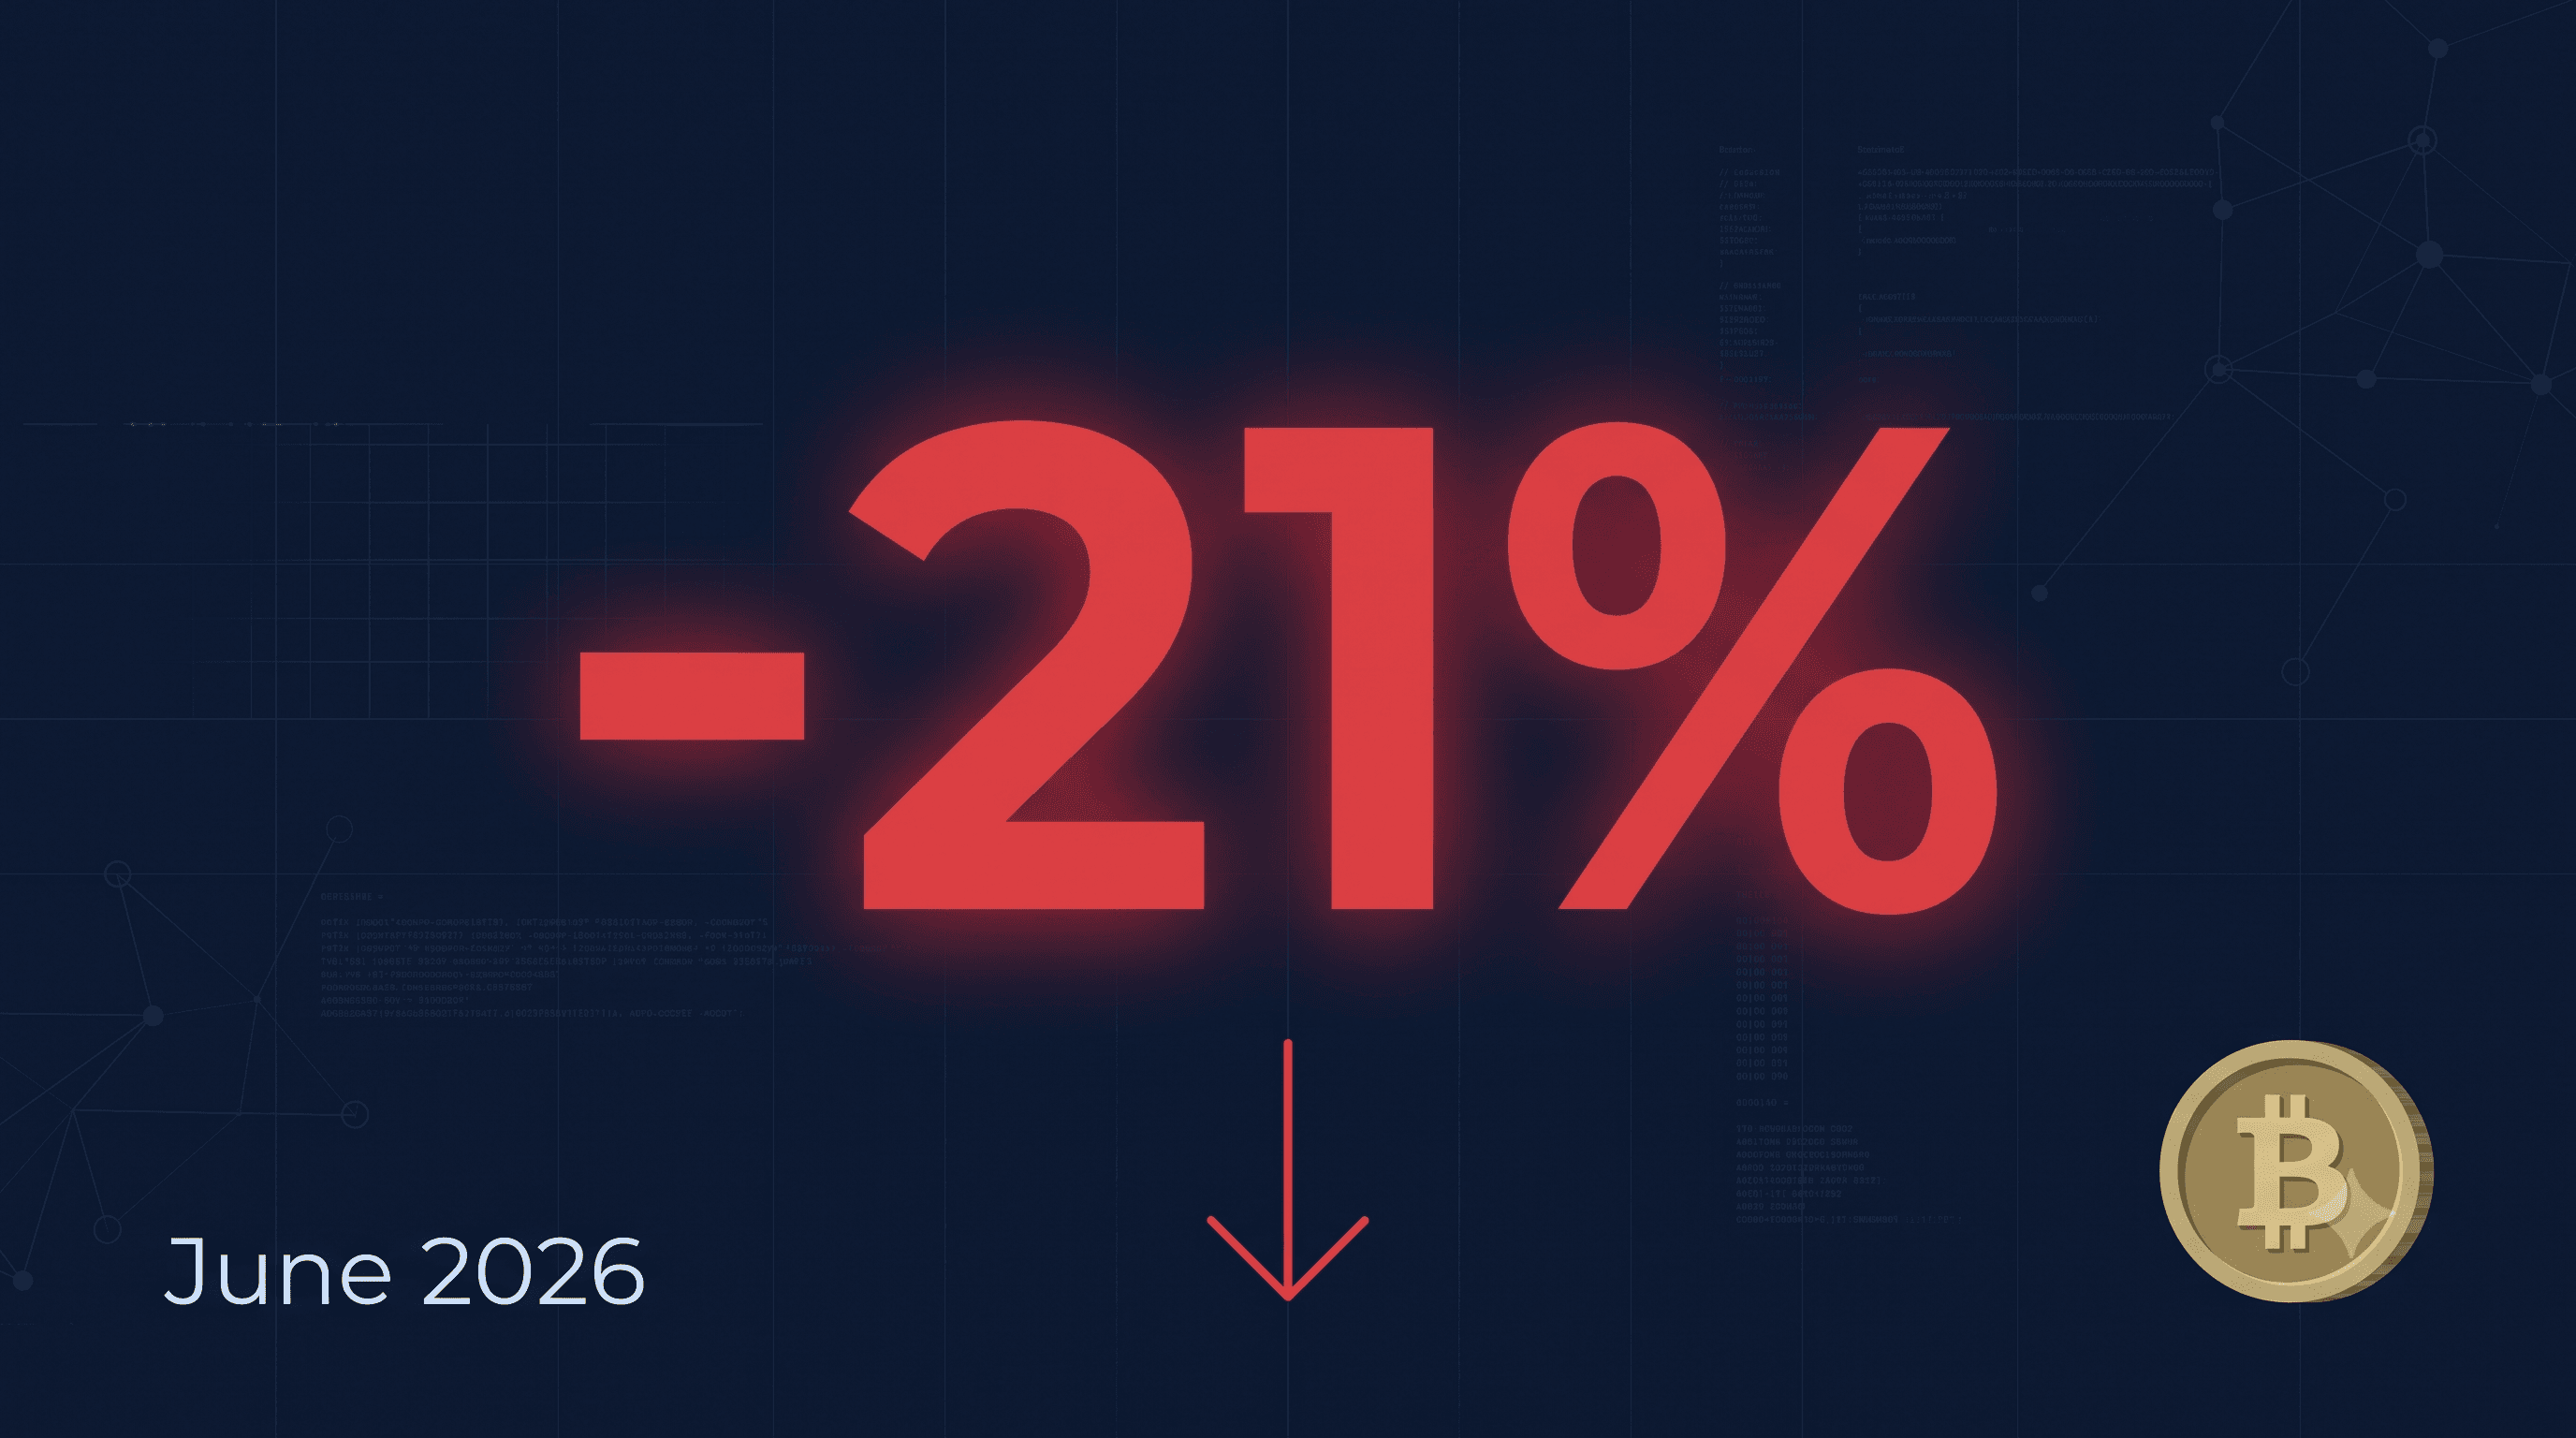
The Worst Month of the Year: Bitcoin Dropped 18%, Ethereum 21% in June — Here's What Happened and Why
June 2026 will go down as one of the worst months in recent crypto history. Bitcoin lost 18.4% of its value — from $73,674 on June 1 to $60,159 at the June 30 close, touching an intraday low of $58,115 along the way. Ethereum fell even harder: down 21.6%, from $2,004 to $1,571. It marks the first time since June 2022 that both of the market's two largest assets have simultaneously lost more than 18% in a single calendar month.
What June looked like from the inside
The month opened with immediate selling. In the first seven days, bitcoin lost about 14% — analysts called it the worst week in three years. On June 4, the pressure cascaded: $1.8 billion in forced liquidations cleared leveraged positions across the market in a single session. No relief followed. Mid-month, systematic outflows from spot Bitcoin ETFs resumed, dragging price lower with each trading day. By June 28–29, BTC was testing the 200-week moving average near $58,000 — the level historically considered the most important long-term support for bitcoin. The month closed slightly above it: $60,159.
Record Bitcoin ETF outflows
The month's defining quantitative event was record outflows from U.S. spot Bitcoin ETFs. June closed with $4.06 billion in net redemptions — an all-time record since the products launched in January 2024, surpassing the previous record of $3.56 billion set in February 2025, CryptoBriefing reports. Roughly 75% of June's outflows — about $3.3 billion — came from a single fund, BlackRock's IBIT, the world's largest Bitcoin ETF. According to The Block, the average IBIT investor is now sitting on a loss of roughly 40%. For context: 2026 has become the first calendar year in which U.S. spot Bitcoin ETFs have turned net-negative overall — meaning more has been withdrawn from the funds year-to-date than invested.
"The scale and duration of these outflows suggest that traditional investors remain defensive" — Glassnode analysts.
Who was on the other side of the trade
While ETF investors sold, corporate buyers — primarily companies following Michael Saylor's Strategy model — absorbed the exiting volume. According to research by Vaasblock, the corporate buyers who replaced ETF sellers in June paid an average of around $67,000 per coin. This matters: the selling didn't go into a vacuum — it was absorbed by long-term institutional holders with a time horizon of years, not quarters.
Why now
June's decline didn't have a single cause — it was a confluence of factors hitting at the same time. ETF investor exits kept supply pressure sustained. The Fed signaled it doesn't expect to cut rates before year-end — higher rates reduce risk-asset appeal and strengthen the dollar. Meanwhile, large tech investors rotated capital into AI stocks, which offered far more legible earnings growth than crypto in a stagnant market. Finally, Strategy's announcement of its Digital Credit Capital Framework — which formally allows BTC sales for the first time — hit the "buy-only" narrative and introduced uncertainty around one of the market's key buyers.
Historical context: June is almost always green
The seasonal angle is worth noting. Based on Bitcoin's monthly return history going back to 2012, the median June return is +2.58%, and there have been only five red Junes in twelve years, according to Newhedge data. June 2026 is a rare seasonal anomaly. The last comparable June collapse was in 2022, when the market fell 37% during the Terra ecosystem implosion. The current -18% on BTC and -21% on ETH is less severe than that crisis, but still a major outlier from the seasonal norm.
What's next
Technical indicators present a cautious picture. Bitcoin is trading below both key moving averages: the 20-month EMA ($79,979) and the 50-month EMA ($65,631). The Fear & Greed Index held at 12/100 throughout June — deep in "extreme fear" territory. The one positive signal: the 200-week MA near $58,000 held without being definitively broken. Historically, touching that level in prior cycles has coincided with the formation of a medium-term low — though it has never automatically implied an instant reversal. Seasonally, July has historically been positive for bitcoin, but 2026 has shown atypical behavior across all timeframes.
Takeaway
June 2026 demonstrated that the ETF products that drove growth in 2024–2025 can now act as amplifiers on the downside as well: a record $4 billion outflow from a single product class is qualitatively new for a market that had grown accustomed to treating institutional buyers as permanent bulls. Corporate demand hasn't disappeared — it's simply changed form. The gap between the two types of "institutions" (ETF funds vs. corporate treasurers) will likely be one of the defining narratives of the second half of 2026.
This article is for informational and analytical purposes only and is not investment advice. Historical patterns do not guarantee recurrence. Price data as of the June 30, 2026 close.
Comments (0)
No comments yet — be the first!
Related articles

5 Trading Movies Worth Watching, Even If You Only Trade Crypto
From 1987's Wall Street to Dumb Money's GameStop saga — five trading movies with lessons that apply just as well to crypto investors.

The End of the NFT Era: How the Market Fell 98% From Its Peak and What's Left in 2026
Nifty Gateway and Foundation have shut down, and NFT volumes have collapsed from their 2022 highs. We break down the numbers: a K-shaped market, three collections dominating, and what happened to the pioneering platforms.

CZ Named the Reasons for Crypto's Prolonged Decline — But Not All of Them
Binance founder Changpeng Zhao blamed crypto's prolonged downturn on the AI boom, geopolitics and the four-year cycle. We look at the factors he left out — and why his interview coincided with Binance's own EU exit.